Topological exploration on spiking patterns of hierarchically organized Izhikevich’s neuron model
In a complex system like brain, it is hard to determine the factor to influence the global spiking patterns. One of such factors, in this work, we explored spiking patterns of hierarchically organized neurons. For simulations, we introduced Izhikevich’s neuron model, which enabled us to simulate large-scale networks in a relevant time. To modulate hierarchical organizations, we controlled the hierarchical levels and the number of sub-modules in a module. In addition, we explored the effects of edge density and node degree in a given network. The result showed that neural activities are dependent on the hierarchical organizations and it evokes different spiking patterns for small and large networks. And, it is also important to control the number of synaptic connections in a node so that limited sustained activity may be maintained. Therefore, we suggest that biologically plausible model such as Izhikevich’s model is helpful to study hierarchical organizations optimized for large-scale neural networks.
INTRODUCTION
Human brain, as a complex system, is hard to study how it works and where the intelligence emerges from. Each neuron has about 20,000~40,000 synaptic inputs in neocortex, which corresponds to 8x10⁸/mm3 synaptic density (Abeles, 1991). Furthermore, Neurons operate nonlinearly in a wide range and have very various dynamics in terms of biological spiking patterns (Izhikevich, 2004). These make it important to examine how individual neurons are connected to each other in the whole brain because the brain seems not to be a random network (Barabási 2003a; Barabási, 2003b). In this vein, people are recently trying to make a connection matrix of the human brain or connectome in applied neurobiological field, which will provide a structural description of the human brain (Sporns et al., 2005). In this work, we will briefly review how the characteristics of neuronal architecture influence on neurons’ activities. The neurons’ activities were measured in terms of average firing rates while we changed the hierarchical organizations of neural networks. According to Kaiser and Hilgetag (2010), the hierarchical networks were generated by changing the number of hierarchical levels and modules in each level. Except the two, we kept other parameters constant during the whole simulation. And, instead of using a spreading model based on activation probabilities of neurons (Kaiser et al., 2007), we introduced an Izhikevich’s neuron model with no axonal delay, which made it possible to model computationally demanding neurons. In this way, we could have more plausible model of neurons biologically than the simple probabilistic models. All simulation were repeated and averaged to guarantee the robustness of neural activities.
MATERIALS AND METHODS
Computational modeling and simulation were performed on an Intel® CoreTM2 Duo E7200 (64-bit, 2.53GHz) system using Matlab R2008a (Mathworks Inc., Natick, MA).
Biological Assumptions for Simulation
For fast simulations, we assumed rat-like small brain with max 512 nodes in a network. And further to explore effects of surface sizes, we added cat-like middle brain with 4096 nodes in a network. The firing rates were averaged across 200ms (time steps) and some neurons (under 10%) were initially activated to localize initial activated neurons. In addition, a thalamic input was added to a randomly chosen neuron at each simulation time. For simple simulations, we also assumed that all neurons had no axonal delay and hence there was no change of synaptic weights due to spike-time dependent plasticity (STDP) (Izhikevich, 2006). And for stability, all simulations were averaged across 20 trials.
Topology of Hierarchical Networks
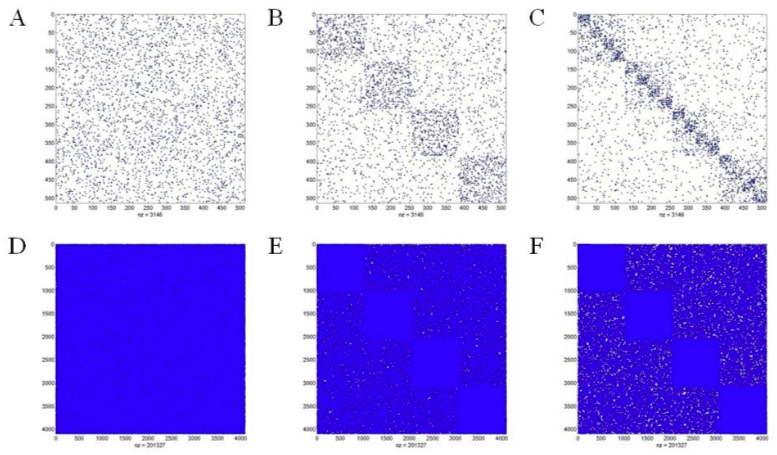
The basic algorithm to generate hierarchical networks is the same as Kaiser and Hilgetag (2010). There are l hierarchical levels in a network, each of which includes m modules. Edge density per node was kept constant as network sizes were varied and as a default, the total number of edges E was distributed to the different levels with Ei edges on level i, so that each level received the same number of edges: Ei = E / (h+l). Totally, maximum 4 levels and 20 modules were simulated in this work (Fig. 1). The number of sub-modules per module was varied in steps of two. Please refer to Kaiser and Hilgetag (2010) for the detail algorithm to generate hierarchical networks. Unlike Kaiser and Hilgetag (2010), nodes in this work represent cortical neurons, not cortical columns, as we do not have relevant column models yet. For the simplicity, we do not assume any synaptic asymmetry between dendrites and axons, which is not the same as real neurons. Nonetheless, controlling the number of levels and modules in each level were enough to understand the conditions for criticality in complex excitable networks.
Izhikevich’s Neuron Model
An Izhikevich’s neuron model with no axonal delay was used for the hierarchical networks. It is a relatively simple model of spiking neurons that combines computational efficiency of integrate-and-fire and resonate-and-fire models and biological plausibility and versatility of Hodgkin-Huxley type models. There are two variables and four parameters to specify model’s properties: v (membrane potential), u (membrane recovery variable), a (time scale of u), b (sensitivity of u), c (after-spike reset value of v), and d (after-spike reset of u). The network includes both excitatory and inhibitory neurons with 4:1 ratio and we assigned randomly selected values to c and d of excitatory neurons so that each neuron becomes tonic spiking or tonic bursting, which achieves heterogeneity of the network (Izhikevich, 2003). We randomly distributed the inhibitory neurons to prevent one module to have relevant amounts of inhibitory neurons.
Index for Model Evaluation
We measured the average firing rates of neurons to evaluate the characteristics of hierarchical networks. Specifically, we were interested in whether the spiking patterns were modulated by the hierarchical organizations of networks. Since we introduced Izhikevich’s neuron models, we did not need special simulation parameters, for example, activation threshold, spreading probability, and so on. Therefore, we only need to vary parameters related to hierarchical organizations: levels, modules, edge density, and node degree. The result was summarized as the average firing rates. To this end, we first calculated the average firing rates for every levels and modules. And then, we tried to check scaling effects, node and edge effects in hierarchical context. In this way, we explored how the hierarchical organizations influence on the spiking patterns of Izhikevich’s neuron models.
RESULTS
We plotted the spiking patterns of hierarchical networks as simulation time goes in Fig 2. As you see, spiking patterns of each neuron seem to be very sparse. More specifically, the average spiking rates of the networks are 0.233 for network of 512 nodes and 0.444 for network of 4096 nodes in this work (Fig. 3). In contrast, in Kaiser et al. (2007), the fraction of activated nodes was always about 0.8 for random, small-world, and hierarchical cluster networks since initial 10 time steps passed. It might be because simple threshold models for activity spreading used in the previous study did not consider refractory periods of real neurons. The activation and deactivation probabilities seem not to be enough to describe the spiking patterns of hierarchical networks. The Izhikevich’s neuron model has parameters to model such effects after each firing, that is, c and d.
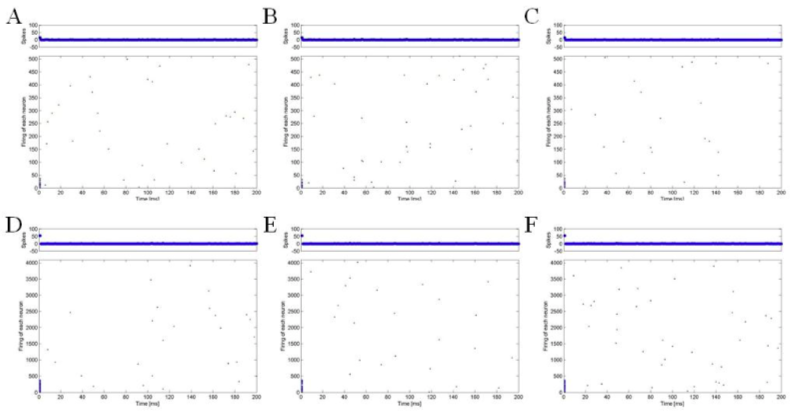
Another thing to note here is that there are no rhythmic oscillation patterns observed in Izhikevich (2003) and Izhikevich (2006). In Izhikevich (2003) and Izhikevich (2006), simulation of a network of randomly coupled spiking neurons showed alpha and gamma band rhythms in 10 Hz and 40 Hz respectively. The rhythmic activity of the spiking models mainly comes from the fact that time-locked activation of groups representing various features of a stimulus results in binding of the features and increased the rhythmic patterns. However, we have no such extra-stimuli, e.g., thalamic inputs, to evoke time-locked activations in the networks because we aimed to investigate only the hierarchical effects of the networks. In this respect, thalamic inputs appear to be important to exhibit collective rhythmic behavior in the frequency range, which is corresponding to that of the mammalian cortex.
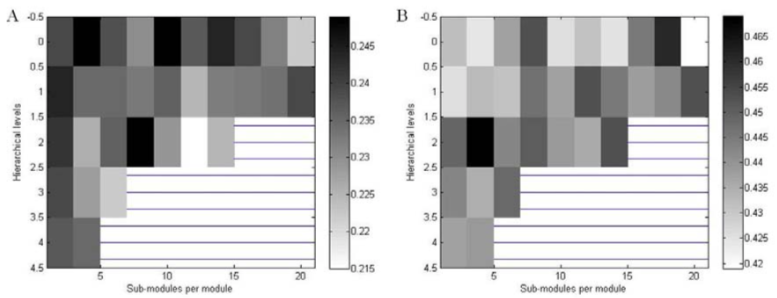
In Fig 3, we presented the average firing rates with constant edge density as hierarchical levels and sub-modules per module varied. According to the hierarchical organizations defined in topology of hierarchical networks, we have small number of sub-modules at higher levels. At a first glance, we found that the average firing rates in cat-like networks were about two times greater than rat-like networks in given constant edge density (at 1.2%) as suggested in Kaiser and Hilgetag (2010). This means that neural activations in larger networks tend to be more propagated through neural connections than in smaller networks. However, for constant global edge density, two networks showed similar patterns of average firing rates except the peaks, which was not shown in the previous study. In case of rat-like networks, there were multiple peaks in level 0 and 2. In case of cat-like networks, however, there were small peaks with sub-modules 4 and 18 in level 0 and 2. In other words, for large networks, it is possible to achieve the largest activations by arranging sub-modules and levels in a relevant manner. In contrast, for small networks, the hierarchical effects were relatively low so that the average firing rates were not different for each level and module. It might be because there were little possibilities to configure hierarchical organizations in the small networks with constant edge density.
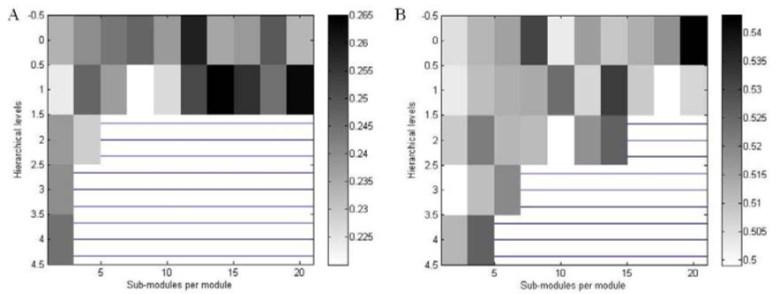
On the other hand, we obtained somewhat different results when the node degree was constant for each level and module. In Fig 4, we had reduced firing rates for higher levels in rat-like networks. Especially, spiking rates at level 2 were almost zero in case that there were many sub-modules. At level 0 and 1, the spiking rates with many sub-modules were relatively high. However, the average firing rate across all levels and modules were similar to the case with constant edge density. In contrast, in case of cat-like networks with constant node degree, the patterns were similar to the case with constant edge density. Similarly, the average spiking rates at specific levels and modules were relatively high, that is, there were distinct peaks at middle range of levels and modules. Moreover, the overall spiking rates were slightly higher than the case with constant edge density, which was not the case in rat-like networks. In short, when the node degree is constant, it is harder to find optimal hierarchical organizations in rat-like small networks. In case of cat-like middle networks, however, it is relatively easier to find such organizations because there are many possibilities to utilize a wide range of optimal hierarchical configurations even if the network levels increased.
In sum, we found that hierarchical organizations were more critical for small networks in terms of the average spiking rates. For large networks, there are relevant hierarchical organizations to achieve high activations and the node degree has greater influences on the average firing rates than the edge density in a given hierarchical network. It is probably because what is important in neuron’s firing rates is not just a neuronal density in the given networks, but the number of synaptic inputs in a specific dendrite, which determines neuronal parameters such as firing threshold and refractory periods. From the scaling effects, at the same time, we learn that the sparseness in a network is important to control the spreading of activity across the whole network, preventing under-activations or over-activations. In this vein, how the network is organized is very important in determining global network activity.
DISCUSSION
In this work, we first aimed to simulate neural activities in various hierarchical organizations. The hierarchical effects in neural networks are well documented in Kaiser and Hilgetag (2010). What we wanted to do here is to explore the same effects in more plausible condition. To this end, we needed to introduce more plausible model of neuron. In Kaiser and Hilgetag (2010), the spreading of neural activities was solely dependent on the probabilities of activation and deactivation between adjacent neurons. In this work, we utilized Izhikevich’s neuron model, which could provide more biological model in terms of neural dynamics, because it was suitable for computationally demanding modeling such as large-scale networks (Izhikevich, 2004; Izhikevich, 2006).
Overall, the result was consistent with Kaiser and Hilgetag (2010) with some notable facts. First, the network size is an important factor to model the brain. In this work, we found that the average firing rates in a given network were different by the network size even if we used same neuron model and hierarchical organization. That means we should be careful to model and predict a certain neural network because the network size itself is critical to determine the output. Biologically, it is also possible that small neural network such as rat’s brain is different from human brain because their brains are different in size. Thus, it implies some limits of animal studies when we apply the result to infer in human (Kuntner et al., 2009).
Second, similar to the Kaiser and Hilgetag (2010), we found that not all hierarchical organizations were allowed to spread neural activities. In our case, hierarchical levels and sub-modules in a given module were critical to determine the firing rates. Especially, it was more evident in rat-like small networks. Also, it was slightly different in cat-like middle networks. From the result, we infer that there might be functional limitations in a network when the neural network is developed, according to the brain size. In other words, it is likely that the distinct brain functions observed in human intelligence might be due to the large brain size. It is not so clear yet, but there are studies to reveal the relationship between brain size or structure and human intelligence (Witelson et al., 2006).
Third, we also found that hierarchical levels and the number of sub-modules in a level have a specific role in determining the neural activities in networks. The levels and modules indicate that there are limitations in spreading of neural activities and the function of network is also likely to be limited in terms of information processing. It is natural in the sense that spiking patterns of single neuron are not enough to implement the complex brain functions. In addition, the hierarchical organization is more efficient for both functional and biological stabilities. Actually, hierarchical structures are often observed in human brain (Riesenhuber and Possio, 1999).
Fourth, as suggested by Kaiser and Hilgetag (2010), a wider range of hierarchical configurations were enabled using constant average node degree, relative to constant edge density. The biological benefits of constant number of connections per node are well described in the previous study. In short, controlling node degree in neural networks is crucial for providing stable neural activities in the developing brain with limited capacity. Importantly, holding a relevant number of connections per node is critical to guarantee limited sustained activity (LSA).
In spite of the above findings, there are some limitations of this work. Most of all, we have no columnar architecture in this work. As your see, cortical areas consist of 6-layerd columns, in which many neurons in similar features are organized vertically. For this reason, the neurons in same column are likely to fire at the same time. Moreover, the neuronal connections between distinct regions are dependent on such structure. Therefore, we need to introduce column model to simulate large-scale networks in more detail.
On top of that, we used randomly selected neurons in the given networks. As shown in Izhikevich (2004), neurons in the brain are not the same. In addition, neuronal types found in the brain are not the same by brain regions. To simulate our networks, we simply consider the ratio between excitatory and inhibitory neurons. The specific types of neurons are randomly selected and hence we cannot know how neural activities are influenced by the neuronal types. Thus, for future research, it needs to study neural activities between heterogeneous neurons.
Another limitation in this work is that there is no consideration for neural plasticity. The neural dynamics of postsynaptic neuron are likely to be influenced by presynaptic neurons’ behavior or spiking patterns. For example, the spiking time-dependent plasticity (STDP) is able to change neural activities even for the same inputs in the long term. The simultaneous activations between adjacent neurons are good to evoke such plasticity. In this work, however, no plasticity between neurons is assumed so that there is no change in neural activities across the whole simulation time.
Lastly, the method to generate hierarchical networks may be enhanced by considering scale-free networks. In terms of brain connectivity, we know that scale-free networks are plausible model (Barabási, 2003b). The scale-free networks have asymmetry between nodes. And, the scale-free networks let an interesting node, Hub, emerge. The Hub is a node which has especially many connections from other nodes, in which there are huge traffics. In a single neuron, asymmetry between axon and dendrite is a fundamental feature. Putting it all together, if we modify the generating algorithm of hierarchical networks, we might have better results.
In conclusion, the present study provided various predictions about neural networks which have different hierarchical organizations. To enhance the plausibility of models, we utilized Izhikevich’s neuron model and thus we obtained similar but a bit different results with the previous studies. At the same time, we considered some biological insights and limitations from the results. From this, we suggest that biologically plausible model such as Izhikevich’s model is helpful to study hierarchical organizations optimized for large-scale neural networks.
REFERENCES
Abeles, M. (1991). Corticonics: Neural Circuits of the Cerebral Cortex. Cambridge Univ. Press.
Barabási, A-L. (2003a). Linked, Plume Books.
Barabási, A-L. (2003b). Scale-Free Networks. Scientific American.
Izhikevich, E.M. (2003). Simple Model of Spiking Neurons. IEEE Transactions on Neural Networks, 14, 1569-1572.
Izhikevich, E.M. (2004). Which Model to Use for Cortical Spiking Neurons? IEEE Transactions on Neural Networks, 15, 1063-1070.
Izhikevich, E.M. (2006). Polychronization: Computation With Spikes. Neural Computation, 18, 245-282.
Kaiser, M. and Hilgetag, C.C. (2010). Optimal hierarchical modular topologies for producing limited sustained activa- tion of neural networks. Frontiers in Neuroinformatics, 4:8
Kaiser, M., Görner, M., and Hilgetag, C.C. (2007). Criticality of spreading dynamics in hierarchical cluster networks without inhibition. New Journal of Physics, 9:110
Kuntner, C., Kesner, A.L., Bauer, M., Kremslehner, R., Wanek, T., Mandler, M., Karch, R., Stanek, J., Wolf, T., Müller, M., and Langer, O. (2009). Limitations of Small Animal PET Imaging with [18F]FDDNP and FDG for Quantitative Studies in a Transgenic Mouse Model of Alzheimer’s Disease. Molecular Imaging and Biology, 11:4, 236-240.
Riesenhuber, M. and Possio, T. (1999). Hierarchical models of object recognition in cortex. Nature Neuroscience, 2:11, 1019-1025.
Sporns, O., Tononi, G., and Kötter, R. (2005). The Human Connectome: A Structural Description of the Human Brain. PLoS Computational Biology, 1:4, 245-251.
Witelson, S.F., Beresh, H., and Kigar, D.L. (2006). Intelligence and brain size in 100 postmortem brains: sex, lateraliza- tion and age factors. Brain, 129:2, 386-398.